Datenwerkstatt Jena 2025
Information on the Data Literacy Datathon at the University Jena
Here you can find detailed information about the "Datenwerkstatt Jena 2025" which will take place at the University Jena 24 - 28 March
Date: March 24th - 28th, 2025
Location: August-Bebel-Straße 4
Registration: Link to the registration formExternal link
Preparation period
Before the start of the 3-day working period, we will be offering preparatory workshops on March 24 and 25 in which we will give you introductions to digital tools to help you process the challenges. All offers during this time are optional and can be taken up according to your own interests.
Project work
As part of the event, participants will work in interdisciplinary teams on one of the challenges from March 26 - 28. Seminar rooms will be available for the groups from 10 am to 6 pm during the event. There we offer you:
The groups are not limited to the "10-to-6" timeframe to work on the challenges and can organize their work on the project independently. There are only a few agenda items for which attendance is mandatory. These will be announced before the start of the event.
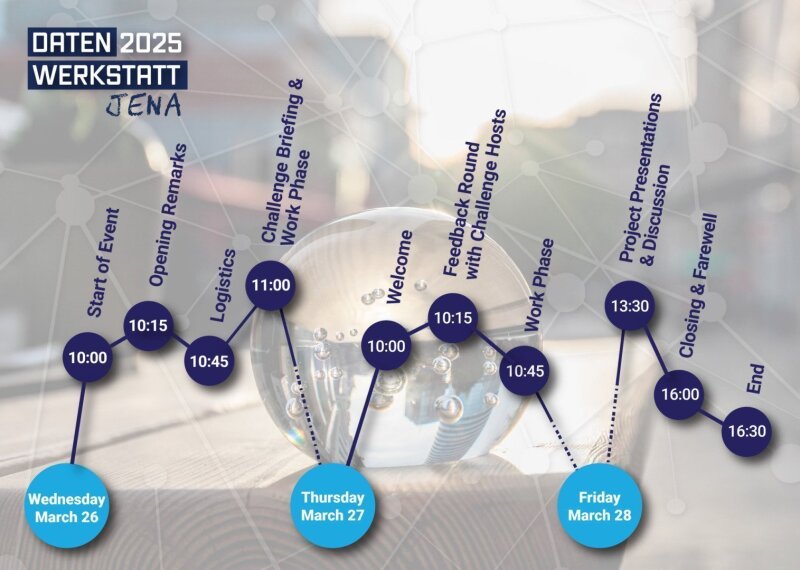
Schedule of the Datenwerkstatt Jena 2025
Picture: Volker Schwartze| Time | Event |
|
10:00 |
Start of the event |
|
10:45 |
Event Logistics |
| 11:00 |
Challenge Briefing and start of working phase |
| Time | Event |
|
10:00 |
Start Day 2 |
| 10:15 | Feedback Session with Challenge Hosts |
| Time | Event |
|
13:30 |
Project Presentations by the Teams Discussion with Participants and Challenge Hosts |
| 16:00 |
Closing Remarks and Farewell |
| 16:30 |
End of the event |
Here are descriptions of the different challenges. Categories are provided to help you better understand the nature of each challenge.
Classic: Data and questions are provided by our partners and are to be solved through data analysis.
Conceptual: Development of concepts for answering questions (What data is needed? How can it be obtained? How can it be made usable for others?)
Creative: Development of, for example, visualizations, infographics, or dashboards on various topics.
The challenges section is currently under construction and will be extended over time.
Challenge type: conceptionell, creative
3D digitization and visualization is becoming increasingly important in museums and university collections in research and education (see the activities of AG3DExternal link). Many institutions now present 3D assets on their portals and in digital exhibitions. At the same time, hardly anyone from the cultural institutions is able to create and edit them themselves - this should change!
In the challenge, participants can experiment with the photogrammetry process to create 3D models - either on provided M2 Macbooks with the app PhotoCatch or on the participants' Windows and Linux systems with, for example, COLMAP or Alicevision Meshroom. The aim is to document the experiments on GitHub - digiKulTh/Datenwerkstatt2025External link in order to collect best practice examples of tools and workflows for future courses and workshops on 3D in cultural institutions and to find out what is possible with comparatively simple means. This is also about gaining initial experience for us. Everything is allowed and interesting!
Challenge type: classic, creative
Last year, elections were held at all levels in Jena/Thuringia: City Council, European Parliament, State Parliament and the Mayor.
The election data is always available in the same organizational units: 97 polling districts and 40 postal voting districts. These have different sizes, different numbers of potential voters and report their constituency results at different speeds. In addition, the electoral districts differ greatly in terms of voting behavior.
At the same time, the outcome of elections is becoming increasingly differentiated. The times when the constituency winner won over 40% of the votes in a constituency are rare in Jena. This raises the question of how these results can be presented appropriately.
The following questions are of great interest:
When working on the challenge , participants also have the opportunity to ask and examine their own sub-questions.
Challenge type: conceptionell
The University of Jena is committed to sustainability and aims to continuously improve in this area over the coming years. The university's Green Office is therefore active in various areas of the university in order to further improve the sustainability of processes. To this end, existing university data sets in particular are to be used more extensively for monitoring and developing new concepts, but new relevant data sources are also to be tapped where necessary. The challenge offers a broad spectrum of questions that can be flexibly addressed by the Challenge team. The focus is on the following issues:
Sustainability in degree programs: How can we identify and promote sustainability references in our degree programs?
CO2 consumption and digital teaching: How can we measure and reduce the CO2 footprint of the IT infrastructure and digital teaching?
Greenhouse gas balance: How can we create a comprehensive greenhouse gas balance for the University of Jena (e.g. also in the area of business trips, commuting, etc.)?
Biodiversity and green spaces: How can we identify university areas that are suitable for greening and thus promote biodiversity on our campus?
We invite you to contribute your skills and ideas in order to develop innovative solutions to these challenges together.
Challenge type: conceptionell
The University of Jena is a vibrant and diverse place where students, faculty, and staff come together. But how is the university community really doing? How can we measure and represent its well-being?
In the context of this challenge, concepts should be developed to address this question. For example, the following aspects should be considered:
Challenge type: classic, creative
Organizers: openDVA (University of Jena)
The openDVA working group deals with the digitalization of the German administration. The focus here is on XZuFi, the data transmission standard for finding responsibilities and describing services in public administration. We are investigating how XZuFi can be used to make administrative services more transparent and accessible, especially for the general public. As part of the challenge, we are providing a data set of XZuFi files.
This can be examined to answer the following questions, for example:
How can the data be transformed to make it more useful, for example for interested citizens?
Here you'll find information about the introductory workshops for the Datathon. The list is currently under construction and will be further revised until the event.
| Datum | Uhrzeit | Thema | Trainer |
| 24 March | 09:00 - 13:00 | 3D Modeling in Blender | Johannes Kretzschmar |
| 14:00 - 17:00 | Data and Project Management Basics | Pascal Scherreiks | |
| 25 March | 9:00 - 17:00 | Crash Course R | Martin Kerntopf |
| 9:00 - 17:00 | Crash Course Python | Volker Schwartze |